AI dashboards are changing how businesses make decisions, saving time and boosting efficiency. They don’t just show data - they analyze, predict, and provide actionable insights. By 2025, 90% of business leaders are expected to rely on AI insights, up from just 30% in 2019.
Here’s what AI dashboards can do:
- Real-time insights: Instantly process live data to adapt to market changes.
- Pattern recognition: Identify trends and relationships in complex datasets.
- Predictive analytics: Forecast customer behavior and future trends.
- Automation: Alert users to anomalies and optimize performance.
Key Benefits:
- Efficiency Gains: Companies like Levi Strauss cut stock shortages by 15% and operational costs by 20%.
- Cost Savings: Unilever reduced marketing costs by 11.8% using AI forecasting.
- Higher ROI: Businesses using AI-driven marketing see 20–30% higher returns.
AI dashboards are making advanced analytics accessible to entire teams, not just specialists, and are reshaping how businesses approach growth and strategy.
Core Functions of AI Predictive Dashboards
Live Data Visualization
AI dashboards transform complex marketing data into easy-to-understand visual insights, all in real time. They handle massive datasets to showcase essential metrics like customer acquisition costs, conversion rates, and campaign performance in a way that's clear and actionable.
Companies leveraging AI-powered visualization tools have reported a 451% increase in qualified leads. This surge comes from the ability to identify trends and tweak campaigns on the fly.
Some standout visualization features include:
- Dynamic Heat Maps: Highlighting user engagement trends across different channels.
- Interactive Funnel Analysis: Mapping customer journeys in real time.
- Cohort Performance Tracking: Displaying behavior and lifetime value of specific customer groups.
- Campaign ROI Monitoring: Providing live updates on return on investment across various channels.
AI-Based Forecasting
Building on visualization, AI-driven forecasting takes things a step further by analyzing past and present data to sharpen predictions. Businesses that use AI for marketing have seen 20–30% less ad spend wasted and an average marketing cost reduction of 11.8%.
For instance, Unilever uses AI forecasting across its 400+ brands, processing over 100TB of marketing data daily. This approach has cut their cost-per-acquisition by 17% while boosting conversion rates by 14%. These tools give marketers the power to reduce inefficiencies and fine-tune campaigns for better results.
Automated Performance Alerts
AI dashboards also include automated alerts, ensuring quick responses to sudden shifts in performance. These tools constantly monitor data and flag critical anomalies, which is essential since only 7% of marketers effectively use real-time data for immediate decision-making.
Here’s what the alert system tracks:
| Metric Category | Key Indicators | Alert Triggers |
|---|---|---|
| Campaign Performance | CTR, Conversion Rate, CPC | Sudden performance drops |
| Budget Management | Daily Spend, ROI, ROAS | Overspending or underspending |
| User Behavior | Session Duration, Bounce Rate | Unusual changes in user activity |
| Revenue Impact | Sales, Revenue per Channel | Significant fluctuations |
The Evolution of Dashboards: From Static to AI-Powered Insights
4 Leading AI Dashboard Tools
Here’s a breakdown of four standout platforms that are reshaping predictive analytics for marketing. Each offers unique features to help marketers make smarter decisions.
Experiment Driven Growth OS
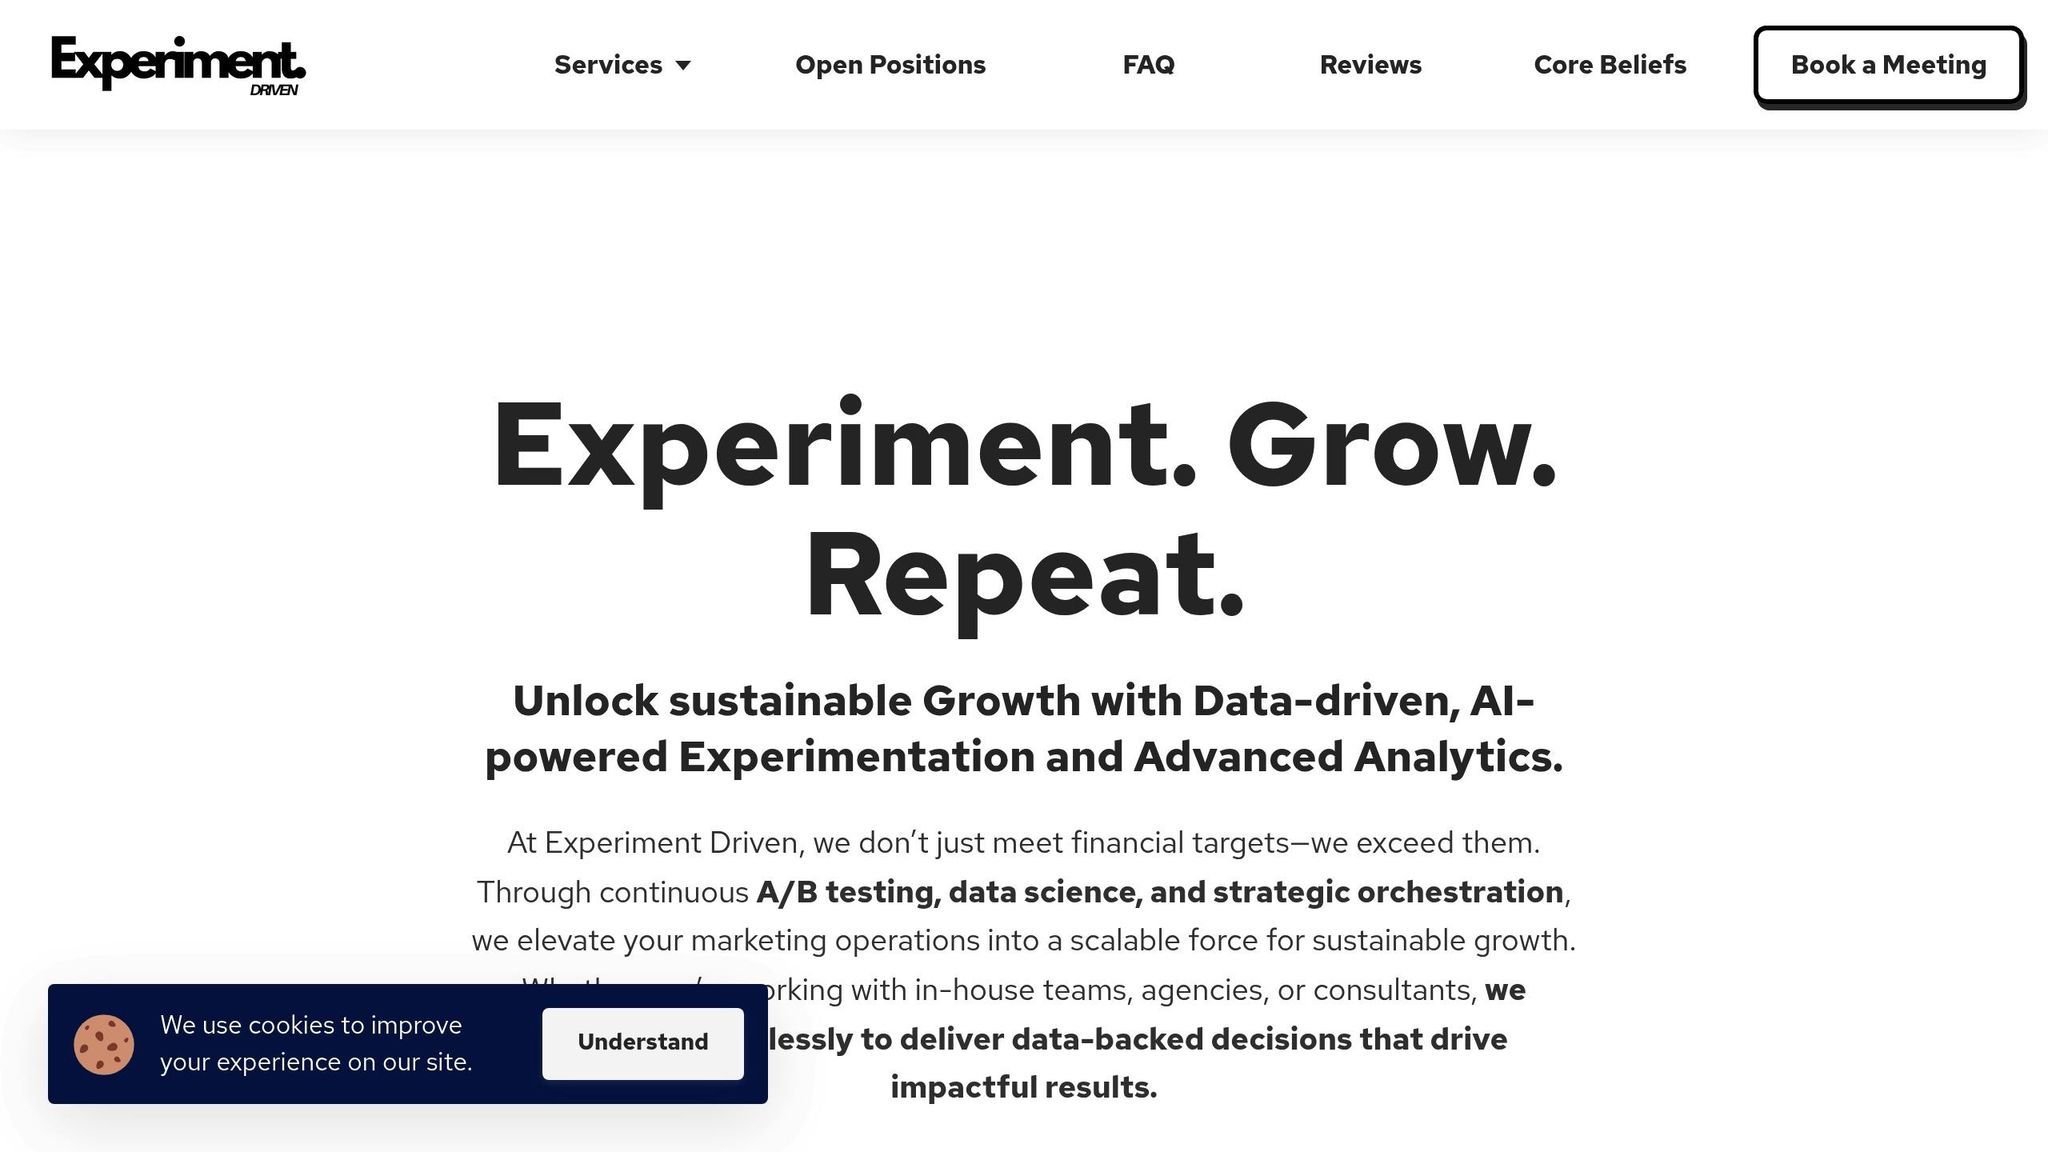
Experiment Driven's Growth Operating System is all about continuous experimentation and tracking performance. This platform shines when it comes to monitoring key marketing metrics like Customer Acquisition Cost (CAC), Lifetime Value (LTV), and cohort payback periods across various channels. Its AI engine handles massive datasets, turning them into actionable insights for marketers.
Key features include:
- Real-time dashboards for live metric tracking
- Advanced A/B testing tailored for creative strategies and content
- Incrementality testing across multiple marketing channels
- Cohort analysis paired with predictive LTV modeling
Tableau Predictive Analytics
Tableau takes marketing data visualization to another level with its forecasting capabilities. By leveraging exponential smoothing models and integrating with tools like R and Python, Tableau empowers marketing teams to perform complex statistical analyses effortlessly.
"If we didn't have Tableau, we would be behind where we are today and need more staff to do the same amount of work. These consumable, dynamic dashboards are making a really big difference for us and our customers."
- Andrew Richardson, Vice President, Analytics and Marketing Science, Tinuiti
"For REI it's incredibly important for us to think about how we can leverage analytics as a competitive advantage to discover insights and provide a better customer experience for the customers that we've serviced for 78 years - and continue to do so in the future."
- Clinton Fowler, REI Analytics Director
Sisense Machine Learning Engine
Sisense is making waves with its AI-powered predictive analytics engine, which has proven highly effective in optimizing marketing efforts. Companies using Sisense have reported a 21% increase in organic revenue year-over-year, significantly outpacing the industry average of 12%.
Key features include:
- Automated payback forecasting
- LTV:nCAC modeling for improved customer insights
- Seamless integration of cross-channel marketing data
- Predictive trend analysis to anticipate market shifts
ThoughtSpot Search Analytics
ThoughtSpot has revolutionized marketing analytics with its search-driven approach, making it easier for teams to uncover insights without relying on technical expertise. For example, Neobank Northmill saw a 30% increase in sign-up completion rates after adopting ThoughtSpot's solution.
| Feature Category | Capabilities | Impact Metrics |
|---|---|---|
| Data Analysis | Interactive Liveboards | 96% reduction in report generation time |
| Query Processing | SpotIQ AI Engine | 300% increase in data queries |
| Marketing Insights | Automated Trend Detection | Real-time anomaly detection |
| User Experience | Natural Language Search | Reduced dependency on technical teams |
Setup Guide: AI Dashboard Integration
Data Source Connection
Bringing together multiple data streams is made possible through advanced ETL pipelines.
Initial Data Assessment
Start by auditing your CRM, analytics, and advertising data. Look for duplicates, inconsistencies, and formatting issues. Standardizing this data ensures a smooth integration process.
Source Integration
Connect your primary data sources using the methods outlined below:
| Data Source Type | Integration Method | Update Frequency |
|---|---|---|
| CRM Systems | API Connection | Real-time |
| Ad Platforms | Direct Integration | Hourly |
| Analytics Tools | Custom ETL Pipeline | Daily |
| Social Media | API Webhooks | Real-time |
Once your data sources are integrated, the next step is configuring KPIs to extract actionable insights.
Marketing KPI Setup
Defining the right KPIs is essential for effective analytics. Focus on these key conversion metrics:
- Site Visit to Lead Ratio: Tracks how effectively site visits turn into leads.
- Lead to Marketing Qualified Lead (MQL) Ratio: Measures the quality of leads generated.
- MQL to SQL Ratio: Evaluates how well marketing-qualified leads convert to sales-qualified leads.
- SQL to Quote Ratio: Assesses the efficiency of the quoting process.
- Quoted to Closed Customer Ratio: Monitors the success rate of closing deals.
With your KPIs in place, prioritize securing your data to maintain trust and compliance.
Data Protection Standards
Protecting your data is non-negotiable when it comes to building consumer trust.
| Protection Area | Implementation Steps | Compliance Goal |
|---|---|---|
| Consent Management | AI-powered preference tracking | GDPR/CCPA alignment |
| Data Processing | Encryption and secure storage | Data security |
| Access Control | Role-based permissions | Information privacy |
| Audit Trails | Automated logging | Compliance documentation |
Companies leveraging AI-driven compliance tools report 54% fewer privacy-related fines. Here's what you should do:
- Conduct Data Protection Impact Assessments (DPIAs) for high-risk processes.
- Establish clear data governance protocols.
- Keep detailed records of AI-driven decisions.
- Regularly audit and update your systems.
"There are more and more privacy regulations coming into play that are designed to protect the way consumer data is used, how brands have access to the data, and how they might share the data."
- Rusty Warner, Vice President and Analyst, Forrester
sbb-itb-d4df0e6
New Developments in AI Dashboards
AI-powered dashboards are stepping up their game, making data interpretation even sharper. With advancements in real-time insights and forecasting, these dashboards are pushing boundaries in data visualization and analysis. The latest trends bring features like 3D visualization and automated ad content analysis, reshaping how marketers approach their strategies.
3D Marketing Metrics Display
Three-dimensional visualization is changing the way marketers view and interpret campaign performance. By using interactive tools, these displays uncover patterns that might otherwise go unnoticed in complex datasets. On top of that, Augmented Reality (AR) and Virtual Reality (VR) are being integrated to take these visualizations to the next level, offering a more immersive way to analyze data.
AI Ad Content Analysis
AI is now diving deep into ad content - whether it’s images, videos, or social media posts - to uncover consumer preferences and how brands are perceived. Building on predictive analytics, these tools bring a new level of sophistication to content evaluation:
- Dynamic Content Evaluation: AI systems analyze ad performance in real time. For instance, Wells Fargo uses AutoML to fine-tune features and keep an eye on accuracy drift.
- Predictive Performance Modeling: PayPal employs Graph ML to identify user data patterns, helping to refine their campaign strategies.
- Automated Optimization: American Express uses synthetic data to test new models while ensuring privacy is maintained.
By blending predictive and prescriptive analytics, businesses are making smarter decisions. A great example is UPS's ORION platform, which optimizes delivery routes to save costs.
The momentum behind these advancements is undeniable. A whopping 92% of businesses plan to invest in generative AI tools within the next three years. And the AI marketing sector? It’s on track to hit $217.33 billion by 2034, underscoring just how central AI is becoming to marketing analytics.
Conclusion: Results from AI Dashboard Use
AI dashboards have shown an impressive 126% profit increase compared to traditional analytics methods.
Take Tesco, for example. Their use of AI led to a 25% boost in customer engagement, a 17% rise in basket size, a 30% cut in marketing waste, and a 15% improvement in inventory management. On top of that, AI-driven automation has enhanced data accuracy by 95% while slashing processing time by 80%.
"AI-powered dashboards didn't just improve our data reporting; they transformed how we think about strategy. The ability to forecast trends and automate decision-making has saved us millions in missed opportunities."
- David Reynolds, CFO of NextGen Manufacturing
Northmill Bank AB saw a 30% increase in conversion rates thanks to their AI analytics. Tobias Ritzén, their former CFO, explained how personalization plays a key role:
"It is all about being as relevant and personal as possible so users' personal finance can benefit from the insights. It can be getting a notification of a discount deal at your favorite cafe or a tailored offer to lower the cost of your insurance."
- Tobias Ritzén, Former CFO of Northmill Bank AB
These examples highlight a larger trend: AI-driven marketing consistently delivers 20–30% higher ROI compared to traditional campaigns. With 90% of business leaders projected to rely on AI-generated insights by 2025, it's clear that AI-powered dashboards are reshaping how businesses achieve growth and efficiency.
FAQs
How do AI-powered dashboards improve business decision-making compared to traditional tools?
AI-powered dashboards are changing how businesses make decisions by delivering real-time insights and advanced predictive analytics that surpass what traditional tools can handle. Instead of relying on static reports or manual data crunching, these dashboards use machine learning algorithms to process massive datasets, identify patterns, and forecast future trends. This gives companies the ability to act quickly and make well-informed decisions, keeping them ahead of market shifts.
What sets AI dashboards apart is their intuitive and interactive design. Users can explore data through natural language queries, getting immediate, actionable responses. This makes data accessible to everyone in the organization, even those without technical backgrounds, breaking down the barriers often associated with traditional data analysis. By automating complex processes and presenting clear, actionable insights, AI dashboards enable businesses to remain flexible and competitive in today’s fast-moving landscape.
How can AI dashboards be integrated with existing data systems to enhance predictive analytics?
Integrating AI dashboards into your current data systems involves a few key steps to ensure everything runs smoothly. First, take a close look at your existing data infrastructure. Can it handle the demands of AI tools? You might need to upgrade storage, boost processing power, or confirm that your systems are compatible with the AI technologies you plan to use.
The next step is data cleaning and preparation. For AI models to deliver accurate predictions, they need high-quality, well-organized data. This means tackling inconsistencies, filling in any missing information, and formatting the data so it’s ready for AI analysis. Once your data is in good shape, select the AI tools and machine learning algorithms that best fit your objectives - whether that’s predicting trends, improving efficiency, or refining marketing strategies.
Lastly, don’t just set it and forget it. Regularly monitor and fine-tune your AI models to keep them performing at their best. As new data comes in, adapt the system to maintain accuracy and ensure your team gets insights they can trust and act on.
How can businesses protect data and stay compliant when using AI-powered dashboards for marketing analytics?
Ensuring Data Protection and Compliance with AI-Powered Dashboards
When using AI-powered dashboards, protecting data and maintaining compliance should be top priorities for any business. Start by following relevant privacy regulations like GDPR and CCPA. These laws require that personal data be collected, stored, and used in a way that's both transparent and ethical. For example, businesses must secure user consent and provide clear communication about how data will be managed.
It's also critical to establish robust data governance practices. Techniques like encryption and anonymization help safeguard sensitive information from unauthorized access. Additionally, conducting regular audits of AI systems can uncover risks such as biases or potential privacy breaches. These audits also help ensure your systems keep up with changing legal requirements.
To stay ahead, consider using compliance-focused tools. Dashboards that offer real-time insights into regulatory adherence allow teams to monitor and manage data protection efforts more effectively. By prioritizing privacy and staying proactive, businesses can not only meet legal standards but also build trust and accountability in their analytics processes.